What a World Cup Forecasting Model Teaches About Trusting a Model at All
A model can hit its headline accuracy target and still be wrong on the exact numbers a decision depends on. That gap is the reason a calibration check belongs before every go/no-go call built on a probabilistic or simulation-based forecast, not after.
What decision is this really about?
A team weighing a market-entry date, a launch window, or a resource allocation off a model's probabilities is not asking "is this model roughly right." It is asking whether the model is right on the specific cells the decision turns on. Those are two different questions; a model can pass the first while failing the second without it ever showing up in a top-line accuracy number.
Christopher Fonnesbeck's June 12, 2026 PyMC Labs group-stage forecast illustrates the difference between aggregate fit and decision-relevant checks. It is a predictive football example, rather than a Subconscious result or causal-effect estimate.
Build the model, then interrogate it
The forecast represented each national team's attacking and defensive strength as an unobserved rating. Goals were count outcomes, and new matches changed the ratings instead of leaving them fixed. The result was a distribution over possible scores, group standings, and advancement outcomes rather than one supposedly certain answer.
Producing probabilities is only the beginning of validation. In a posterior predictive check, draws from the fitted model generate plausible new datasets. Those replications are then tested against observed patterns, especially the individual quantities that control the decision. The Stan project's documentation describes this method as a way to discover when a model fails to reproduce important features of the observed data (Stan Documentation, "Posterior and Prior Predictive Checks").
Where the check caught the model
The forecast's aggregate numbers looked fine: the share of teams scoring 0, 1, 2, or more goals in a match, and the 0-0 scoreline rate, all fell inside the model's predicted range.
| Statistic | Observed | Model's 95% predictive interval | Verdict |
|---|---|---|---|
| Share of sides scoring 0 goals | 0.330 | 0.327 to 0.343 | Inside |
| 0-0 scoreline rate | 0.085 | 0.079 to 0.092 | Inside |
| Rate of 1-1 finishes | 0.104 | 0.089 to 0.102 | **Miscalibrated** |
| Rate of 2-2 finishes | 0.036 | 0.028 to 0.036 | Outside in the source; rounded endpoints obscure the boundary |
| Overall draw share | 0.231 | 0.210 to 0.229 | Miscalibrated |
Real matches ended level more often than the model's assumptions allowed. The model treated each team's goal count as statistically independent of the other's, a common simplification traceable to score-modeling work going back to Maher (1982), but a posterior predictive check flags which statistics the model fails to reproduce, not why; one plausible explanation is that two sides sitting at 1-1 late in a match play differently than the independence assumption implies. Whatever the mechanism, the result showed up as a small, specific miscalibration: too few predicted 1-1s and 2-2s.
The draw-rate discrepancy matters for group standings, but its impact on advancement probabilities needs a direct comparison of specifications. Predictive checks reveal where fit fails, while a causal account of playing behavior requires additional evidence. See Visualization in Bayesian Workflow.
How do you fix the flagged cells without fixing the whole model?
Because the check pointed at specific cells rather than a vague "the model is off," the fix could be specific too: a small mixture term that adds extra probability to level scorelines at 1-1 and 2-2, tuned so it moved only the cells the check flagged and left the calibrated cells, including the 0-0 rate, untouched. Re-running the same predictive check afterward showed every flagged statistic back inside the model's interval.
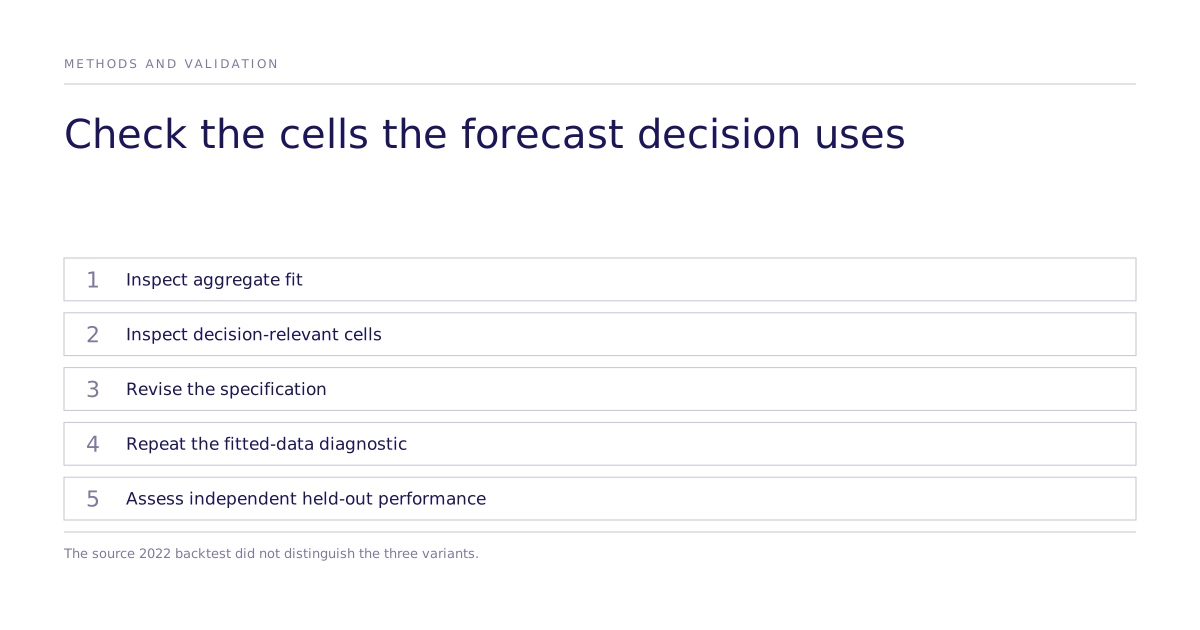
The re-check shows that the fitted correction changes the flagged statistics. Because those statistics were used to tune it, the re-check is not independent evidence of predictive improvement. The source backtests three variants on the 2022 tournament and reports that their predictive scores are not distinguishable. Preserve that result when choosing a specification.
What does this mean for trusting a model before a decision?
The lesson generalizes past football. A model built to inform a consequential call, such as where to launch, when to enter a market, or which segment to fund, should be checked against the specific quantities that call depends on, not against a single top-line accuracy figure.
For a simulated choice result used in a business decision, specify a matched human population, stimulus, treatment, endpoint and agreement criterion. Confirm recruitment, fieldwork ownership and deliverables with the provider, and document any protocol adaptations. The research record supplies aggregate choice-parameter-rank evidence; it does not establish forecast calibration or a validation result for this decision. The study workflow provides context for the brief.
Before a team commits budget on the strength of any model's output, probabilistic, simulation-based, or otherwise, the standing question is the one this forecast had to answer for its own scorelines: not "is the aggregate accuracy good," but "is the model calibrated on the exact numbers this decision is riding on."