Why a 20% Retention Rate Means Different Things for a 10-User Cohort and a Million-User Cohort
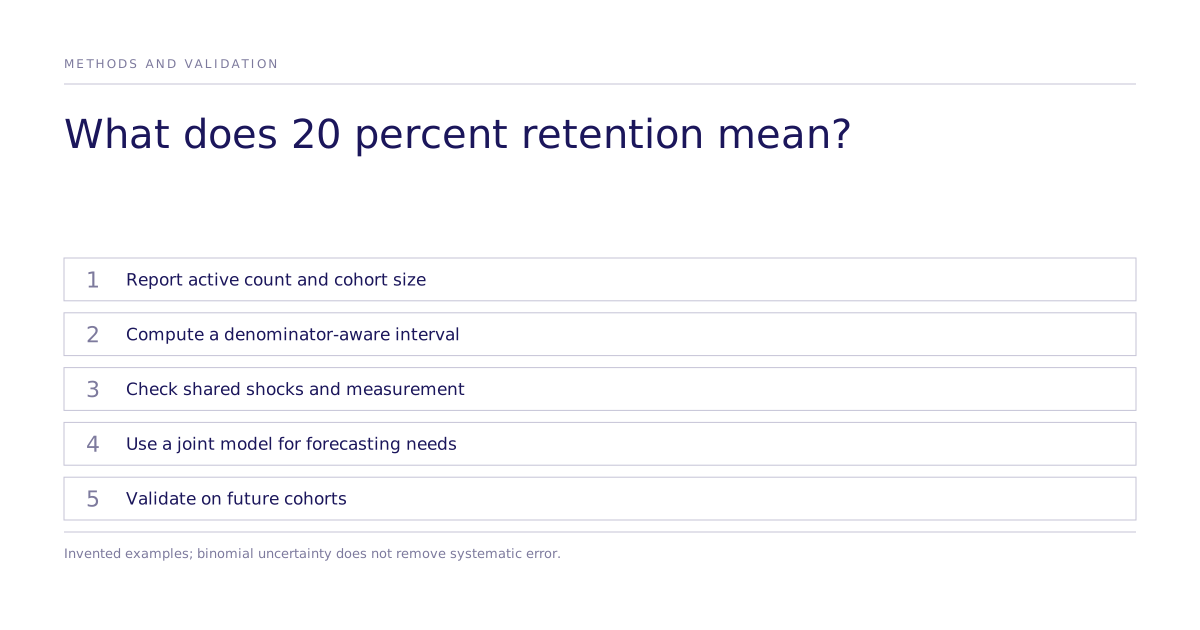
A marketing analytics lead sees 20 percent retention. Two active users out of ten and 200,000 out of a million have the same observed ratio, but different sampling uncertainty under a binomial model. Report the numerator, denominator, measurement window and assumptions before using the rate to compare acquisition channels.
A retention ratio needs its denominator
Retention is always between zero and one, and it's a quotient: active users divided by cohort size. Two cohorts can post the same 20% and carry completely different amounts of information.
| Cohort | Cohort size | Retention rate | How much that number tells you |
|---|---|---|---|
| A | 10, with 2 active | 20% | Wilson 95% interval approximately 5.7% to 51.0% |
| B | 1,000,000, with 200,000 active | 20% | Wilson 95% interval approximately 19.92% to 20.08% |
These are invented cohorts and conditional binomial intervals. A dashboard can use a Wilson proportion interval from the count and denominator without building a new forecasting model. A binomial regression can also represent rates with their trial counts.
How do you model active users instead of a ratio?
A binomial likelihood ties the number of active users to cohort size and an underlying retention probability:
N_active ~ Binomial(N, p)Here N is cohort size and p is the retention probability. A binomial model assumes appropriately measured, conditionally independent trials with a common probability within the modeled group. Shared acquisition or operational shocks, repeated users and selection can violate that simplification. Consider cohort/time effects or overdispersion, and validate prediction intervals on future cohorts.
A companion revenue model follows the same logic: revenue per cohort-period is modeled with a distribution tied to the number of active users and an average-revenue-per-user parameter, so retention and revenue share the same cohort-level uncertainty rather than being reconciled after the fact.
What this buys forecasting, specifically
Juan Orduz's Cohort Revenue and Retention preprint and PyMC Labs tutorial illustrate a joint forecasting approach using binomial retention and BART. Such a model can borrow information across cohorts and link revenue uncertainty with activity; its usefulness depends on predictive checks and held-out performance.
Where does this discipline generalize?
Report uncertainty together with assumptions and external validation. An interval alone does not show that a channel caused retention or that a forecast transfers to a new cohort.
What are the limitations, and what doesn't this prove?
This is a modeling-methods explainer, demonstrated on a synthetic dataset with known ground truth so the model's accuracy could be checked against it. It's a useful pattern for anyone building cohort-level CLV forecasts, not a validated production benchmark, and it doesn't establish results in a live, messy revenue dataset. Extending it, by layering in acquisition channel as a covariate, pooling across hierarchical markets, or swapping BART for a neural-network component, is a reasonable next step for a team with the engineering capacity to build and maintain it, not a guarantee of the same interval widths or forecast accuracy on a different business.
Next step
For a young cohort, report counts, window, interval construction and shared-shock assumptions using the proportion-interval reference above. A claim that a channel caused retention needs a separate identification design. The public research record reports aggregate choice-parameter-rank evidence; request a scoped interval-reporting example and matched cohort outcome evidence for the proposed study. See the study workflow when defining that brief.