Does a Simulated Yogurt-Choice Study Match Human Behavior? The Ares Replication
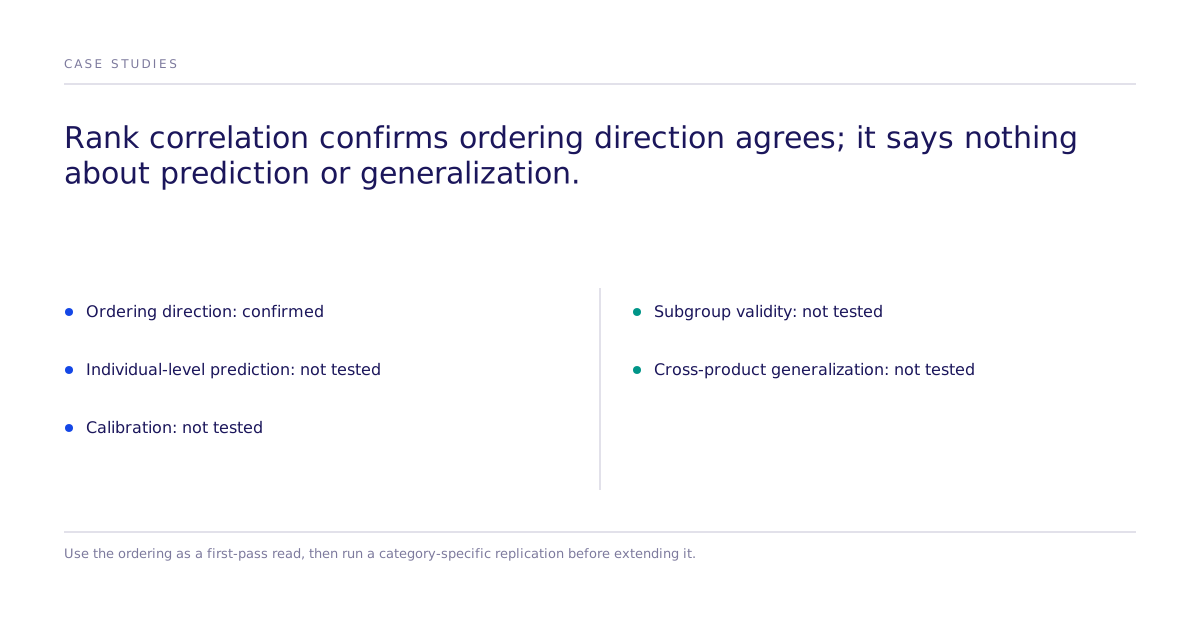
A simulated conjoint study on functional yogurt reproduced the attribute ordering found in a published human study, matching 87% of the measured human ceiling (0.832 of 0.959; see replication methodology). A replication score published without its limits reads as marketing. For a CPG or consumer-research leader deciding whether to trust a simulated study's ranking of choice-driving attributes, that result shows the ordering direction can replicate. It does not show individual-level prediction, calibration, or performance across subgroups.
Why the decision matters
A CPG team weighing a simulated conjoint study against a fielded human study needs to know whether the simulation recovers the same decision ordering, not just a plausible-sounding result. Treating a directional rank correlation as individual-level prediction, calibration, subgroup validity, or a guarantee across products risks a launch decision built on a simulated ranking that generalizes further than the replication supports.
What did the replication compare?
Ares et al. published a study examining how factors unrelated to taste or texture shaped whether shoppers picked functional yogurt over regular yogurt. A matched simulated study compared its attribute-ranking output against the same non-sensory factors. The replication fidelity between the two orderings is the outcome measured.
Evidence
| Study | Population | Method | Result |
|---|---|---|---|
| Ares et al., published in Food Quality and Preference | Human respondents | Conjoint study | Attribute ordering across non-sensory factors |
| Matched simulated replication | Simulated study | Simulated choice comparison against the same non-sensory factors | 0.832 of 0.959 (87% of measured human ceiling) |
The misses sit on the public leaderboard next to the hits. The replication figure of 87% (0.832 of 0.959) is a directional statement about whether the two orderings agree. It says nothing about how closely individual respondent choices matched, and it does not carry over to a different product category without its own replication.
What are the options for validating a simulated ranking?
Three ways exist to check whether a simulated ranking is trustworthy for a given category: trust the simulated study alone, run a fielded human study alone, or compare the two against a matched human study, as in this replication. Only the third produces a testable correlation instead of an assumption.
Recommended decision process
- Identify the published or fielded human study that covers the same product category and choice factors.
- Run the matched simulated study against the same attributes and alternatives.
- Compute the rank correlation between the two attribute orderings, and report the p-value alongside it.
- Treat a significant, positive correlation as support for using the simulated ordering as a first-pass read, not as a substitute for category-specific validation.
Where does Subconscious fit into this?
The replication leaderboard shows how Subconscious tests studies against real human participants, letting a team move from a simulated experiment to real-human validation without changing the underlying causal question. Teams evaluating packaging, claims, or assortment decisions in CPG can use the same matched-replication approach before extending a simulated ranking to a new product line. The broader research method is documented on the research page.
Limitations and failure conditions
Naming the failure mode here gives a buyer something to check before relying on the result. One conjoint replication does not establish individual-level fidelity, calibration, subgroup performance, causal identification, or general validity across products. The rank correlation measures whether the ordering of factors agrees between the two studies; it does not measure preference magnitude, choice share, or any individual respondent's decision. Applying this result to a different product category, attribute set, or subgroup decision needs its own matched replication first.